


By Andy May
This is the text of my presentation on Tom Nelson’s podcast which can be viewed here. The question and answers start at about 18:15 into the interview.
The first IPCC Physical Science Basis report is called “FAR” and was first published in 1990. An updated 1992 version of the report contains this statement:
“global-mean surface air temperature has increased by 0.3°C to 0.6°C over the last 100 years … The size of this warming is broadly consistent with predictions of climate models, but it is also of the same magnitude as natural climate variability. … The unequivocal detection of the enhanced greenhouse effect from observations is not likely for a decade or more.”
(IPCC, 1992, p. 6).
This was an accurate statement at the time, and it is mostly accurate to this day. In the past century (since 1920) temperatures have increased about one degree and I’m not sure we will be able to detect a human enhanced greenhouse effect in ten years, or ever, but otherwise the quote is still accurate. One degree of global warming in a century is well within natural climate variability according to historical records and records of glacier advances and retreats (Vinós, 2022, pp. 89-107).
Glaciers exist today, where no glaciers existed during the Medieval Warm Period from about 800 to 1200AD and during the Holocene Climatic Optimum from about 7500 to 4500BC. In addition, the Vikings farmed parts of Greenland where permafrost exists today. Ötzi, the Tyrolean iceman, who was frozen into a glacier about 5,000 years ago, and only recently discovered in his glacier tomb, can attest to the fact that modern glaciers are more advanced than they were before 3000BC.
The second report, called SAR was published in 1996 and 1997. Chapter 8 was a major issue when it came out because in the original draft, the scientists who wrote it all agreed to include this statement:
“no study to date has both detected a significant climate change and positively attributed all or part of that change to anthropogenic causes.”
(Final draft, approved by all 36 authors, SAR, July 1995)
Yet, in the final meeting of the IPCC supervising committee of government politicians, the editors and lead authors of the IPCC on November 29th, 1995, which went very late and into the early morning of November 30th, this statement was changed to read:
“The balance of evidence suggests a discernible human influence on global climate.”
(IPCC, 1996, p. 4).
This change was agreed by the lead authors and political representatives of the participating countries, and without consulting the scientists who wrote and approved the final draft months earlier (May, 2020c, pp. 230-235). The change caused an uproar in the scientific community with Frederick Seitz, the 17th president of the United States National Academy of Sciences, writing about it in the Wall Street Journal (1996), under the headline “A Major Deception On Global Warming.”
In the article, Seitz writes:
“In my more than 60 years as a member of the American scientific community, including service as president of both the National Academy of Sciences and the American Physical Society, I have never witnessed a more disturbing corruption of the peer-review process than the events that led to this IPCC report.”
Frederick Seitz, the 17th president of the United States National Academy of Sciences
He did not choose the word “corruption” lightly.
The third report “TAR” was published in 2001. It was seriously tarnished by the inclusion and promotion of the notorious “hockey stick” graph that was later shown to be seriously flawed due to major statistical errors and the inclusion of seriously flawed data.
Even so, the IPCC included the following statement that was based on the flawed hockey stick:
“In the light of new evidence and taking into account the remaining uncertainties, most of the observed warming over the last 50 years is likely to have been due to the increase in greenhouse gas concentrations.”
(IPCC, 2001, p. 699).
Numerous reports, peer-reviewed articles, most notably by Stephen McIntyre and Ross McKitrick, Edward Wegman, and the U.S. National Research Council, detailed the numerous flaws in the graph (May, 2020c, pp. 164-198). Analysis showed that random red noise could be fed into the statistical algorithm that was used to create the hockey stick and it still produced hockey sticks.
The fourth report “AR4” issued this statement:
“Most of the observed increase in global average temperatures since the mid-20th century is very likely due to the observed increase in anthropogenic greenhouse gas concentrations.”
(IPCC, 2007b, p. 10).
This was very much like what was written in TAR where the same conclusion was based on the now discredited hockey stick. AR4 backed away from the hockey stick, admitting it was flawed, but it also claimed that there was a very high chance that the Himalayan glaciers would melt by 2035. This is an impossibility it turned out, and the head of the AR4 effort, Rajendra Pachauri had to back down and apologize for the error.
This and other problems with the report led to a U.N. InterAcademy Council investigation that found that the IPCC guidelines for their reports had not been followed and that serious bias had crept into AR4. They also found that a full range of peer-reviewed views were not included.
AR5, published in 2013, included the following statement:
“More than half of the observed increase in global mean surface temperature (GMST) from 1951 to 2010 is very likely due to the observed anthropogenic increase in greenhouse gas (GHG) concentrations.”
(IPCC, 2013, p. 869)”
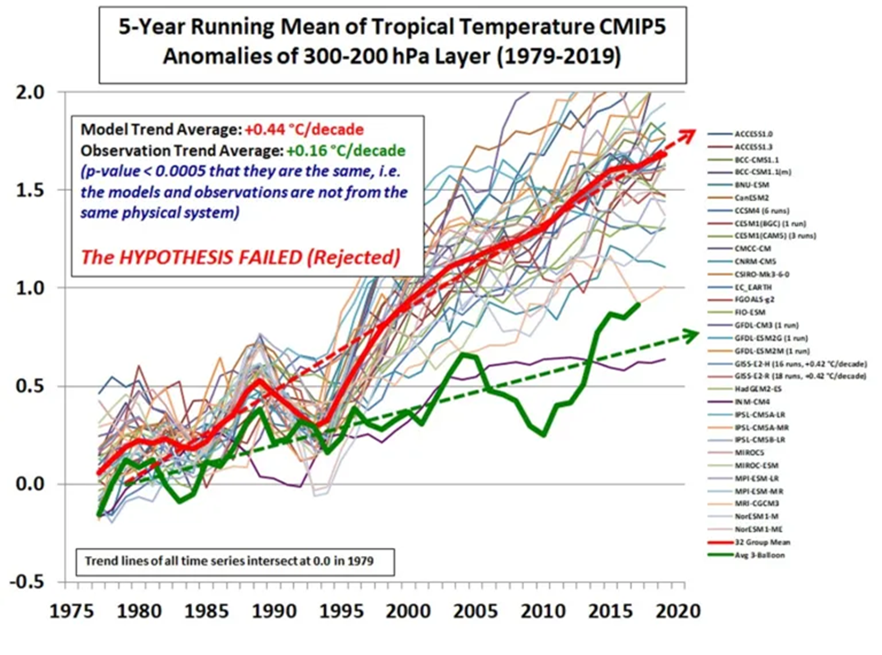
This is very similar to the conclusions of TAR and AR4, but no new evidence is included in the report. Importantly, John Christy, Ross McKitrick, and others had warned the authors of the report that the climate models they were using predicted much more warming in the tropical troposphere than was observed (see figure 1). Still later, Ross McKitrick and John Christy showed that nearly all the AR5 models predicted too much warming at a statistically significant level (McKitrick & Christy, 2018) and this excess warming was dubbed the “hot spot.”
Figure 1. The data is from (McKitrick & Christy, 2018), the plot is from John Christy.
The hot spot still exists in AR6 and has gotten worse (McKitrick & Christy, 2020). It is notable that if the human greenhouse gas emissions are removed from the climate models the fictitious hot spot goes away and the models move much closer to observations.
In AR6 we read the following:
“The likely range of human-induced change in global surface temperature in 2010–2019 relative to 1850–1900 is 0.8°C to 1.3°C, with a central estimate of 1.07°C, encompassing the best estimate of observed warming for that period, which is 1.06°C with a very likely range of [0.88°C to 1.21°C], while the likely range of the change attributable to natural forcing is only –0.1°C to +0.1°C.”
(AR6, page 59).
Thus, they now claim that it is likely all the warming since the 19th century is due to humans. And this is despite the fact that in the tropical troposphere their climate models are statistically invalidated if they include human greenhouse gas emissions in the model.
They were warned to avoid confirmation bias and that the AR5 models were running too hot.
Yet, in AR6, they made the models run even hotter than in AR5 and they ignored dissenting opinions by Richard Lindzen, Roger Pielke Jr., John Christy, Ross McKitrick and many other prominent climate scientists. This is illustrated in figure 2.
Figure 2. The AR6 graph is from AR6, page 444. The AR5 graph is from AR5, page 892. For more on this comparison, go here.
Notice the range of AR5 model results do not touch 0.6, yet in AR6 they do.
In AR6, notice the coupled ocean/atmosphere models (red boxes) produce higher sea surface temperatures than the observed sea surface temperatures (blue boxes). The model/observation mismatch in sea surface temperatures in the Pacific Ocean is a very serious problem.
Besides sea surface temperatures, the IPCC/CMIP climate models have a serious problem with clouds. They cannot model clouds. It is well known and accepted that clouds are net cooling, but how do they respond when surface temperatures rise? What is the net feedback of clouds when the world warms? They don’t know and the uncertainty in the cloud response to warming is nearly as large as the total uncertainty in all modeled surface warming feedbacks.
We find this in AR6 on the subject:
“… CMIP6 models have higher mean ECS and TCR [climate sensitivity to greenhouse gases] values than the CMIP5 generation of 50 models. They also have higher mean values and wider spreads than the assessed best estimates and very likely ranges within this [AR6] Report. These higher ECS and TCR values can, in some models, be traced to changes in extra-tropical cloud feedbacks that have emerged from efforts to reduce biases in these clouds compared to satellite observations (medium confidence). The broader ECS and TCR ranges from CMIP6 also lead the models to project a range of future warming that is wider than the assessed warming range”
(AR6, p 927).
Translation: We adjusted our cloud feedback parameters to try and fix the mismatch with the real world and when we did that, the already too-warm models got worse. They are clearly in that stage of their modeling effort that every time they try and fix a mismatch, they break something else. It is a sign that their models are missing some vital component of climate.
Figure 3 is a plot of model climate feedback to model calculated ECS or equilibrium climate sensitivity to a doubling of CO2 (Ceppi, Brient, Zelinka, & Hartmann, 2017). Remember cloud feedback cannot be modeled, it must be input to the model via user adjustable parameters. The plot tells us that 71% of the model computed ECS is determined by these user input parameters. The models can literally produce almost any ECS the modeler desires.
Figure 3. Modeled cloud feedback to surface temperature versus model calculated ECS (climate sensitivity to a doubling of CO2 or 2xCO2). Data from (Ceppi, Brient, Zelinka, & Hartmann, 2017).
As previously mentioned, the IPCC climate models have a hard time with sea surface temperatures. They not only predict higher sea surface temperatures than observed, they also get the pattern of warming and cooling oceans wrong. It seems they have decided that their models must be correct, so they have assumed that the feedbacks must be changing, and this has screwed them up.
They are fundamentally changing their models such that they cannot be refuted by observations. By hypothesizing a continually changing climate state, they are making their already unfalsifiable ideas even more unfalsifiable. As Karl Marx and his followers found out, if your hypothesis is fluid enough, you can conclude whatever you want, and no one can challenge you. From Karl Popper, 1962, page 37:
“The Marxist theory of history, in spite of the serious efforts of some of its founders and followers, ultimately adopted [a] soothsaying practice. In some of its earlier formulations (for example in Marx’s analysis of the character of the ‘coming social revolution’) their predictions were testable, and in fact falsified. Yet instead of accepting the refutations the followers of Marx re-interpreted both the theory and the evidence in order to make them agree. In this way they rescued the theory from refutation; but they did so at the price of adopting a device which made it irrefutable. They … destroyed its much-advertised claim to scientific status.”
(Popper, 1962, p. 37).
So now AR6 claims that as surface temperatures rise, the feedbacks to that warming change. In one fell swoop, they both explain why their models do not match observations and they invalidate those pesky observation-based calculations of climate sensitivity that are so much less than their model-based estimates.
As you can see in the AR6 maps in figure 4, the modeled ocean temperatures are much simpler than the observed pattern. Further, the cloud cover over South America is increasing, not decreasing as predicted. The models expect the eastern Pacific to warm much more than observed and the western Pacific is warming much more than predicted. The pattern is wrong.
Figure 4. A comparison of observed sea surface temperature changes from 1870 to 2019 to modeled changes. The scales are different because the actual change in CO2, in the top map, is smaller than the model scenario used. But the colors in the maps are compatible.
They claim that the models are OK, they just need to adjust their feedbacks. Richard Seager and his colleagues write:
“The tropical Pacific Ocean response to rising GHGs impacts all of the world’s population. State-of-the-art climate models predict that rising GHGs reduce the west-to-east warm-to-cool sea surface temperature gradient across the equatorial Pacific.
In nature, however, the gradient has strengthened in recent decades as GHG concentrations have risen sharply. This stark discrepancy between models and observations has troubled the climate research community for two decades. … The failure of state-of-the-art models to capture the correct response introduces critical error into their projections of climate change in the many regions sensitive to tropical Pacific sea-surface-temperatures.”
(Seager, Cane, & Henderson, 2019)
AR6 has its own version of the TAR hockey stick, and it is just as flawed as the first one. They also published a refutation of their own version on page 316 of their report, as shown in figure 5. They want us to believe that the last decade was warmer than any decade in the past 125,000 years. The data they rely on from 10,000 years ago to 2,000 years ago only has century (10 decades!) resolution by their own admission. I added the red circle, arrows, and brackets to their figure 2.11.
Figure 5. Modified after AR6, figure 2.11, page 316.
Notice especially the bracket. The uncertainty bars in their plot of temperatures from 10,000 years ago to 2000 years ago are larger than all the recent warming. In other words, their own data does not support their statement. They can’t possibly tell us anything about how the most recent decade compares to any decade prior to around 1850, at the end of the Little Ice Age.
In closing, I could go on and on, but the bottom line is that AR6 is the worst and most biased IPCC Physical Science Basis report ever. SAR through AR5 were bad, but AR6 is beyond help.
Take this from one of the few who has read all of them.
It is very clear that the IPCC is losing the public, polls repeatedly show the world population does not believe global warming is a priority. Recent polls show that skepticism about human-caused climate change is increasing around the world. A recent University of Chicago poll found that the belief that humans have caused all or most climate change slumped to 49% from 60% just five years ago. Seventy percent of the U.S. public are unwilling to spend more than $2.50 a week to combat climate change.
Figure 6. The number of pages in each major IPCC Physical Science Basis Report.
60% of U.S voters believe that climate change has become a religion that has nothing to do with climate. Billions of dollars, six major reports that total 6,543 pages (2,391, or nearly half of them are in AR6 as shown in figure 6) and a total of 47 reports of all kinds, and the public has not been convinced that climate change is important. It’s time for the IPCC to reform or give up, in my opinion.
For more details about the flaws in AR6 read the Clintel report. It was created by an international team of scientists, from seven countries around the world. It has been extensively peer-reviewed by some of the world’s top climate scientists. The cover is shown below as figure 7. It is available as a low resolution pdf for download at clintel.org and will be for sale as a proper ebook or paperback at Amazon, Kobo, and Barnes and Noble on May 29th.
Figure 7. Cover of the new Clintel assessment of the IPCC AR6 report. Download at clintel.org or purchase at your favorite bookseller after May 29th.
Download the bibliography here.
The post Is AR6 the worst and most biased IPCC Report? appeared first on Clintel.
Please consider helping!
Awake Freedom TV On Roku is Broken! 🙂

I could no longer maintain the costs on my own, so I moved the off of a dedicated server which was needed for the TV platform to work. On top of that, I want to build an app Awake Freedom TV app, for mobile phones. We need your help to first resurrect our TV channel, and then build the mobile app. In order to do that, I need a minimum of 800/month on subscription payments. Please help anyway you can with the form below.


Leave A Comment