


How Much of a Threat Are Melting Ice Sheets and Glaciers?
The recent tragic Himalayan flash flood (the source was actually a landslide of the underlying bedrock) has brought to the fore an important question, says Ralph Alexander. How much do we need to be concerned about melting ice, from both glaciers and ice sheets?
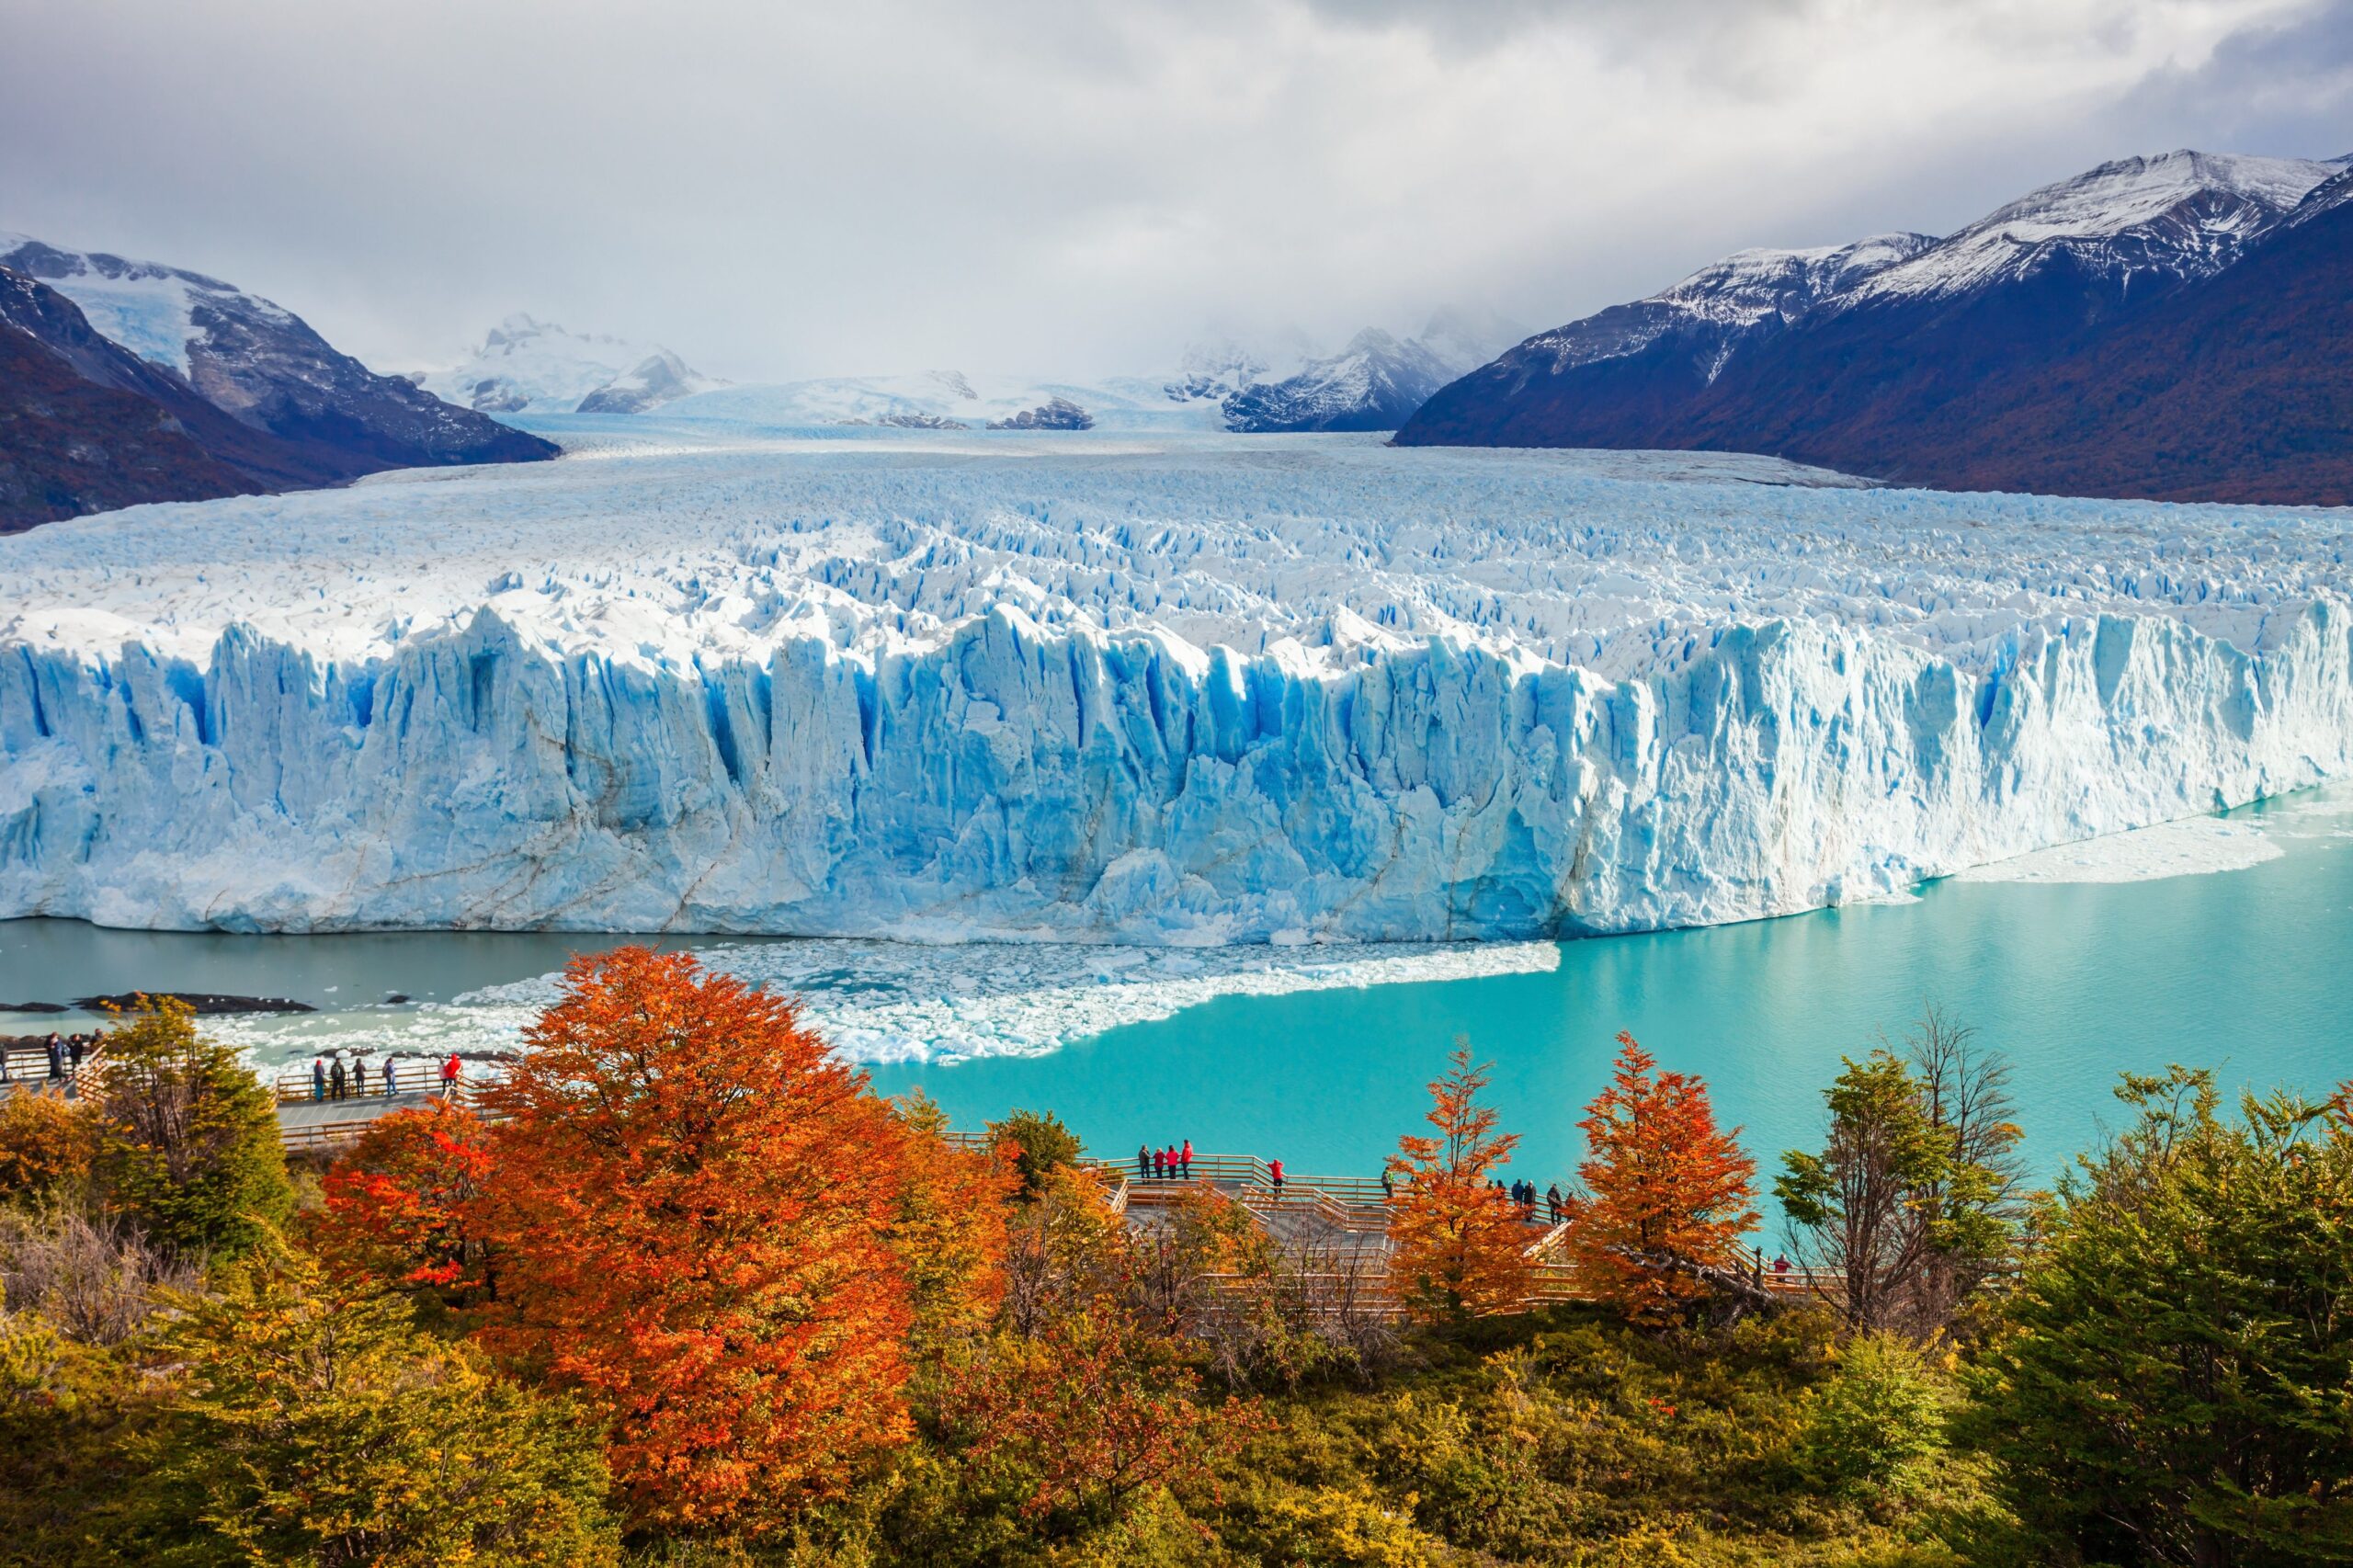
Perito Moreno Glacier in Argentina. (Source: Shutterstock)
Ralph Alexander
Date: 15 September 2026
Glaciers are found all over the planet. They number over 200,000 excluding the massive ice sheets of Antarctica and Greenland. Unsurprisingly, most glaciers are retreating as the world warms. However, what is not well known is that the retreat began early in the 19th century as global temperatures started to rise following the Little Ice Age – long before human CO2 emissions became significant. This is illustrated in the figure below.
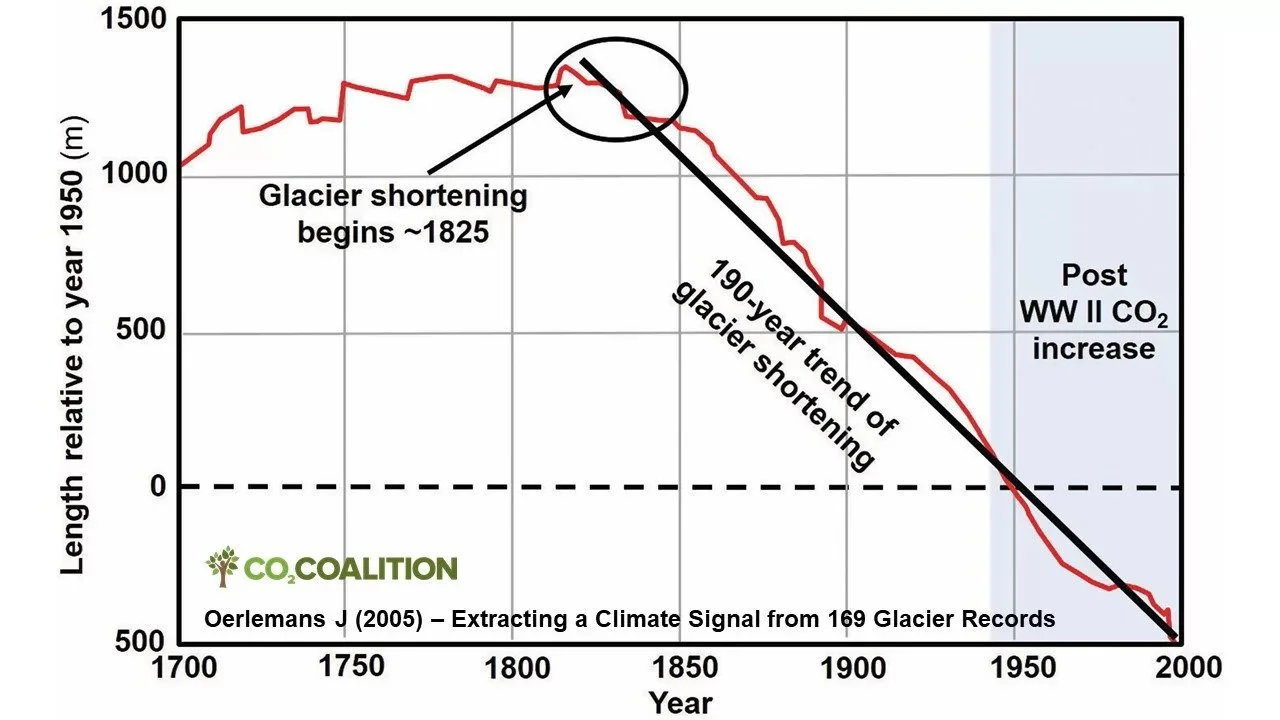
It has been estimated that complete melting of all Earth’s glaciers and ice sheets will take several thousand years, but smaller mountain glaciers could vanish during this century. Nevertheless, not all glaciers are retreating. About 10% are actually advancing or periodically advancing and retreating. Recent surveys have found advancing glaciers in Alaska, Norway and Switzerland, for example.
Sea level
Like ice sheets, melting glaciers – including those in Antarctica and Greenland – contribute to rising sea levels. At present, this contribution is 25-30% of the observed increase in global sea levels, corresponding to an annual rise of approximately 1 mm as shown in the next figure. The mass change is measured in billions of tonnes (gigatonnes, Gt).
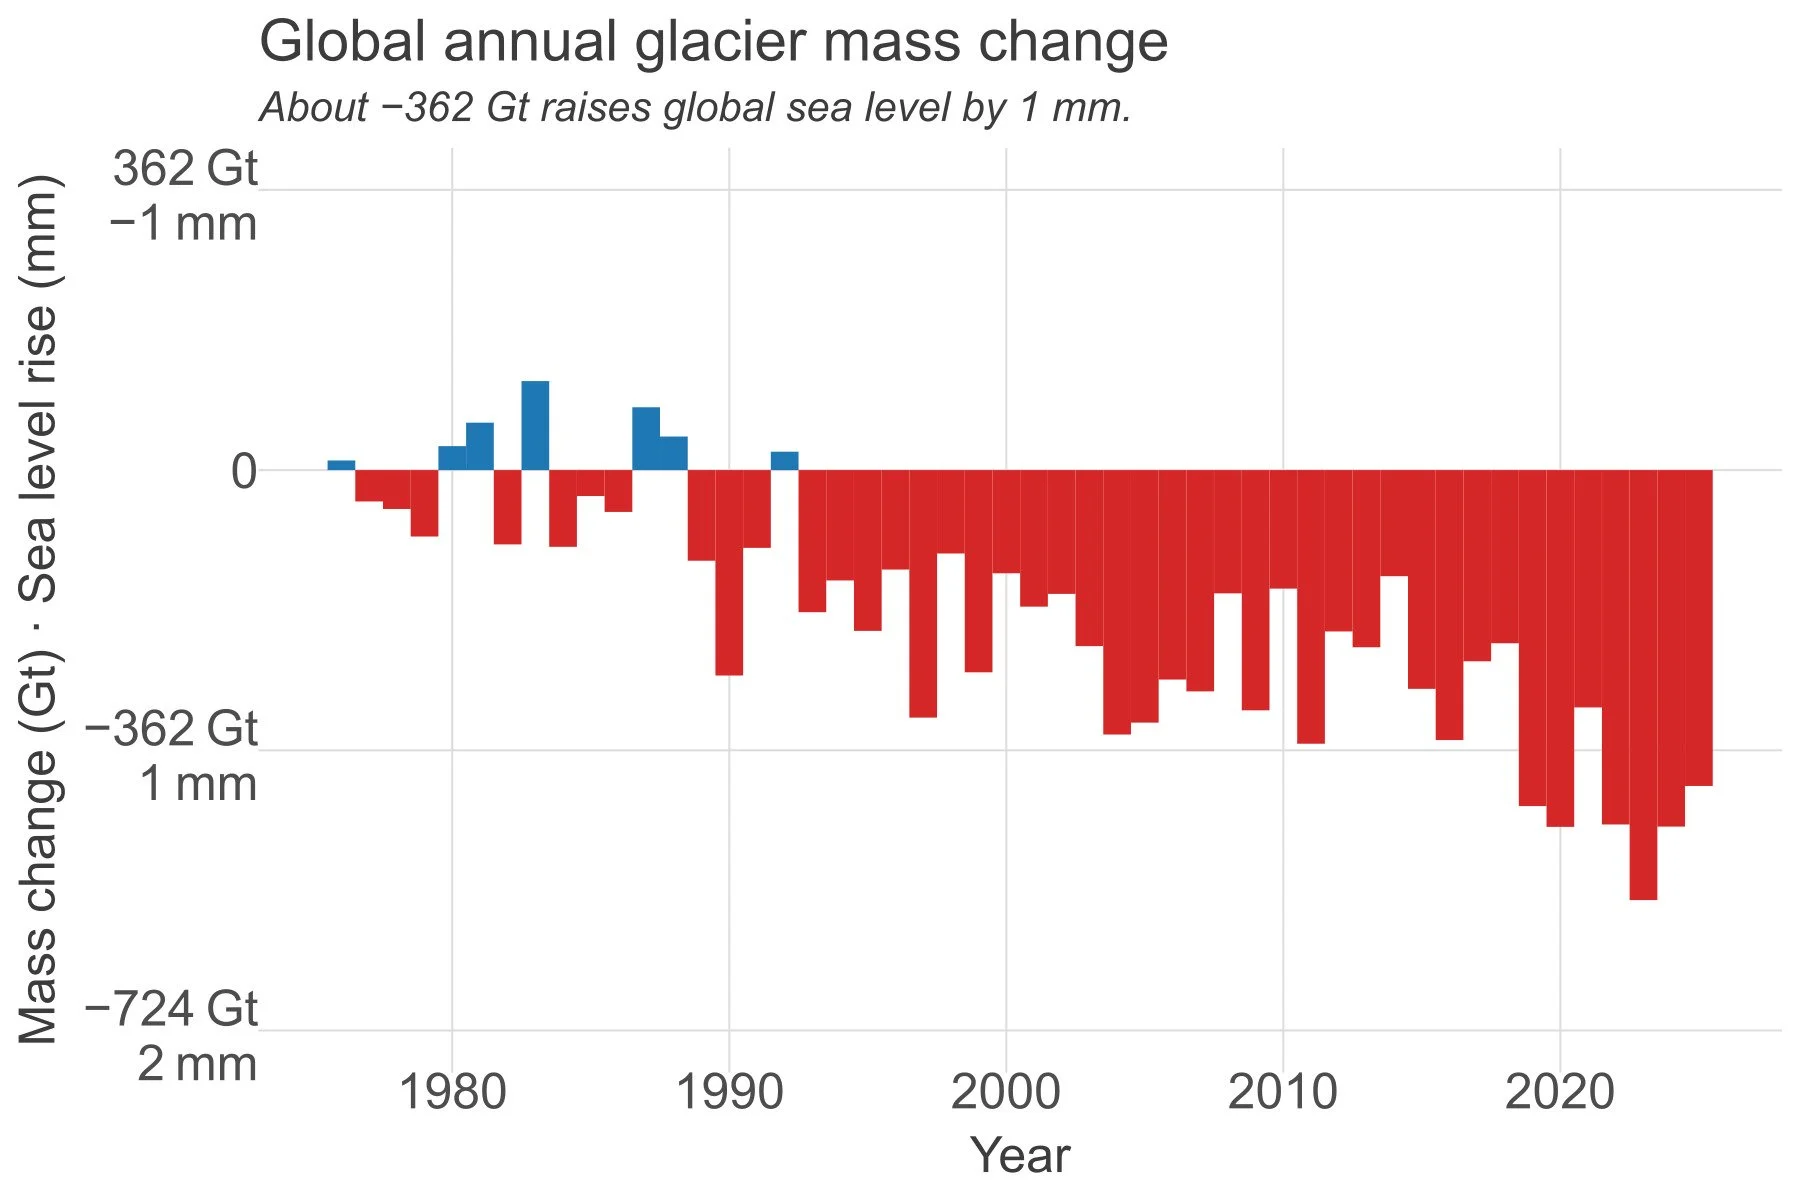
But for mountain glaciers, a bigger threat than their contribution to sea level rise is the flash flooding caused by melting ice, especially from those glaciers that are not in remote areas but close to human settlements.
Despite the claims of climate alarmists that the devasting flood in Nepal and Tibet was caused by global-warming induced glacial collapse, scientists soon figured out that the source of the calamitous event was actually a landslide of the underlying bedrock. This resulted in a massive chunk of the glacier breaking off and falling about 2 km into a river, the shattered ice gathering rock debris, sediment and river water as it rushed downstream at speeds approaching 150 km per hour.
Regardless of the cause, the flood was devastating in terms of loss of life and property. Many commentators have pointed out, however, that the flood would have been less deadly had an early warning system been in place, allowing people to escape to higher ground or evacuate – as is found elsewhere in the world in areas subject to natural disasters. Improvements in planning and engineering to safeguard structures may have minimized property damage too.
Greenland
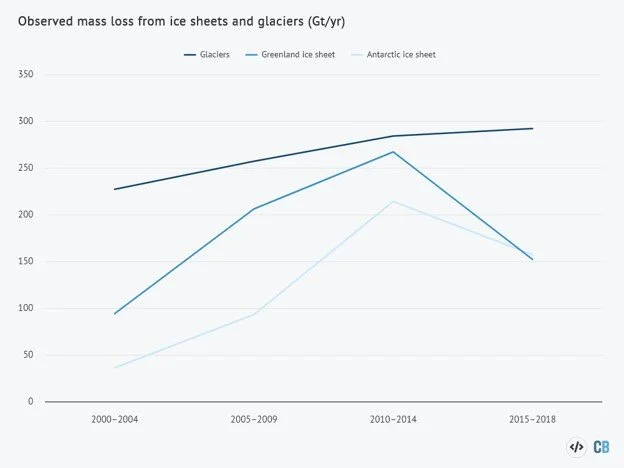
The mass loss from glaciers currently dominates that from the ice sheets of Antarctica and Greenland, which together store about 99% of all the fresh water on Earth. The following figure shows the annual rate of ice mass loss from all three sources between 2000 and 2019.
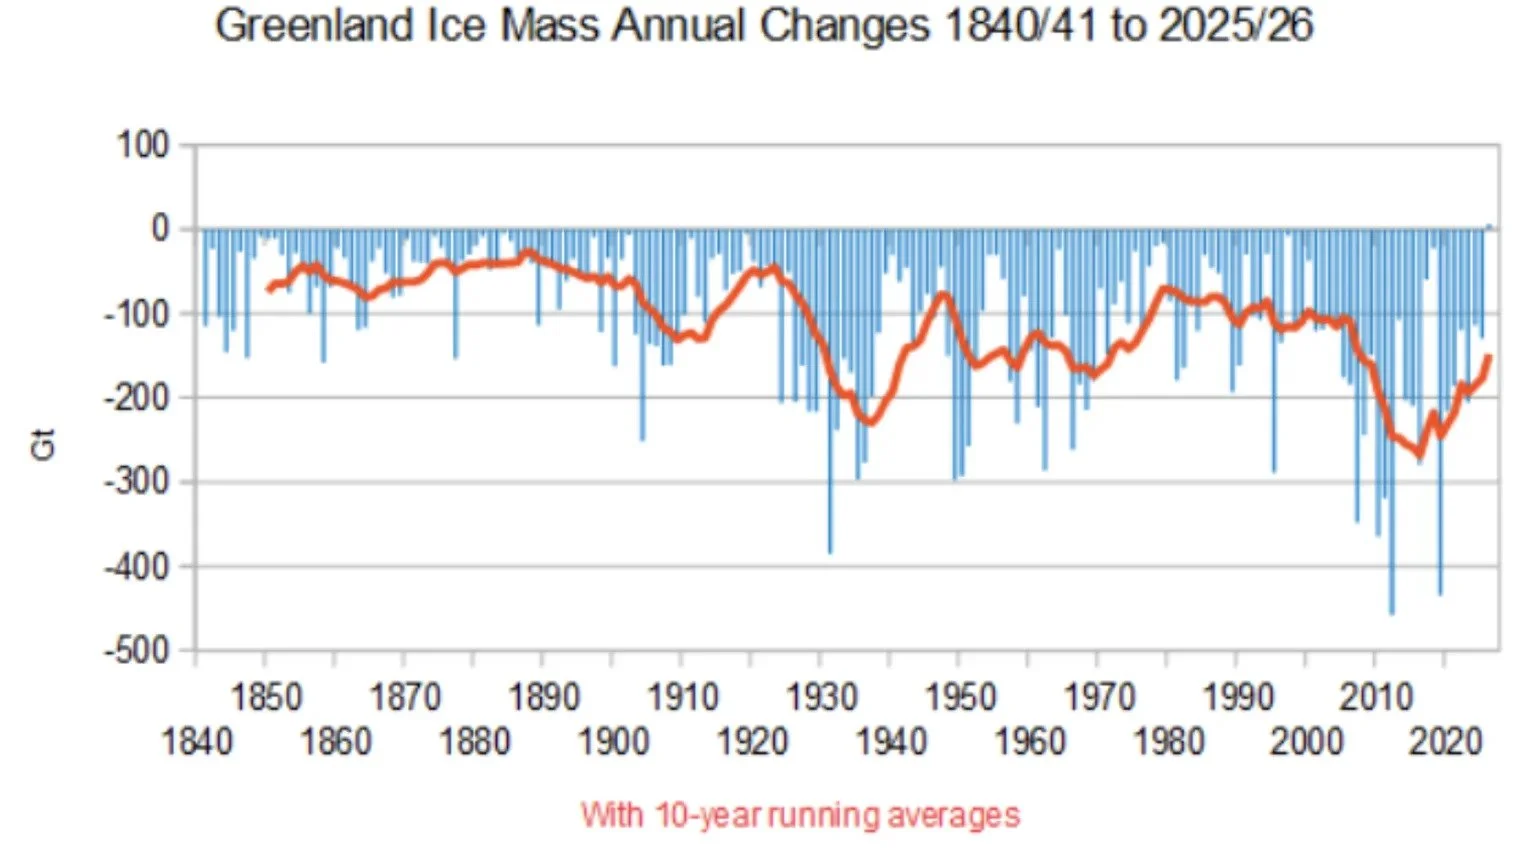
Greenland’s ice sheet holds only about 10% as much ice as Antarctica’s. We hear more about it because the Greenland ice sheet is melting at a faster rate and has contributed more to sea level rise. But the melt rate is no faster today than it was 90 years ago and has slowed over the last few years. The next figure shows the change in the total Greenland ice sheet mass going all the way back to 1840. The increase in ice loss that began around 2000 has since reversed due to above-average winter snowfall; the historical data exhibits similar fluctuations.
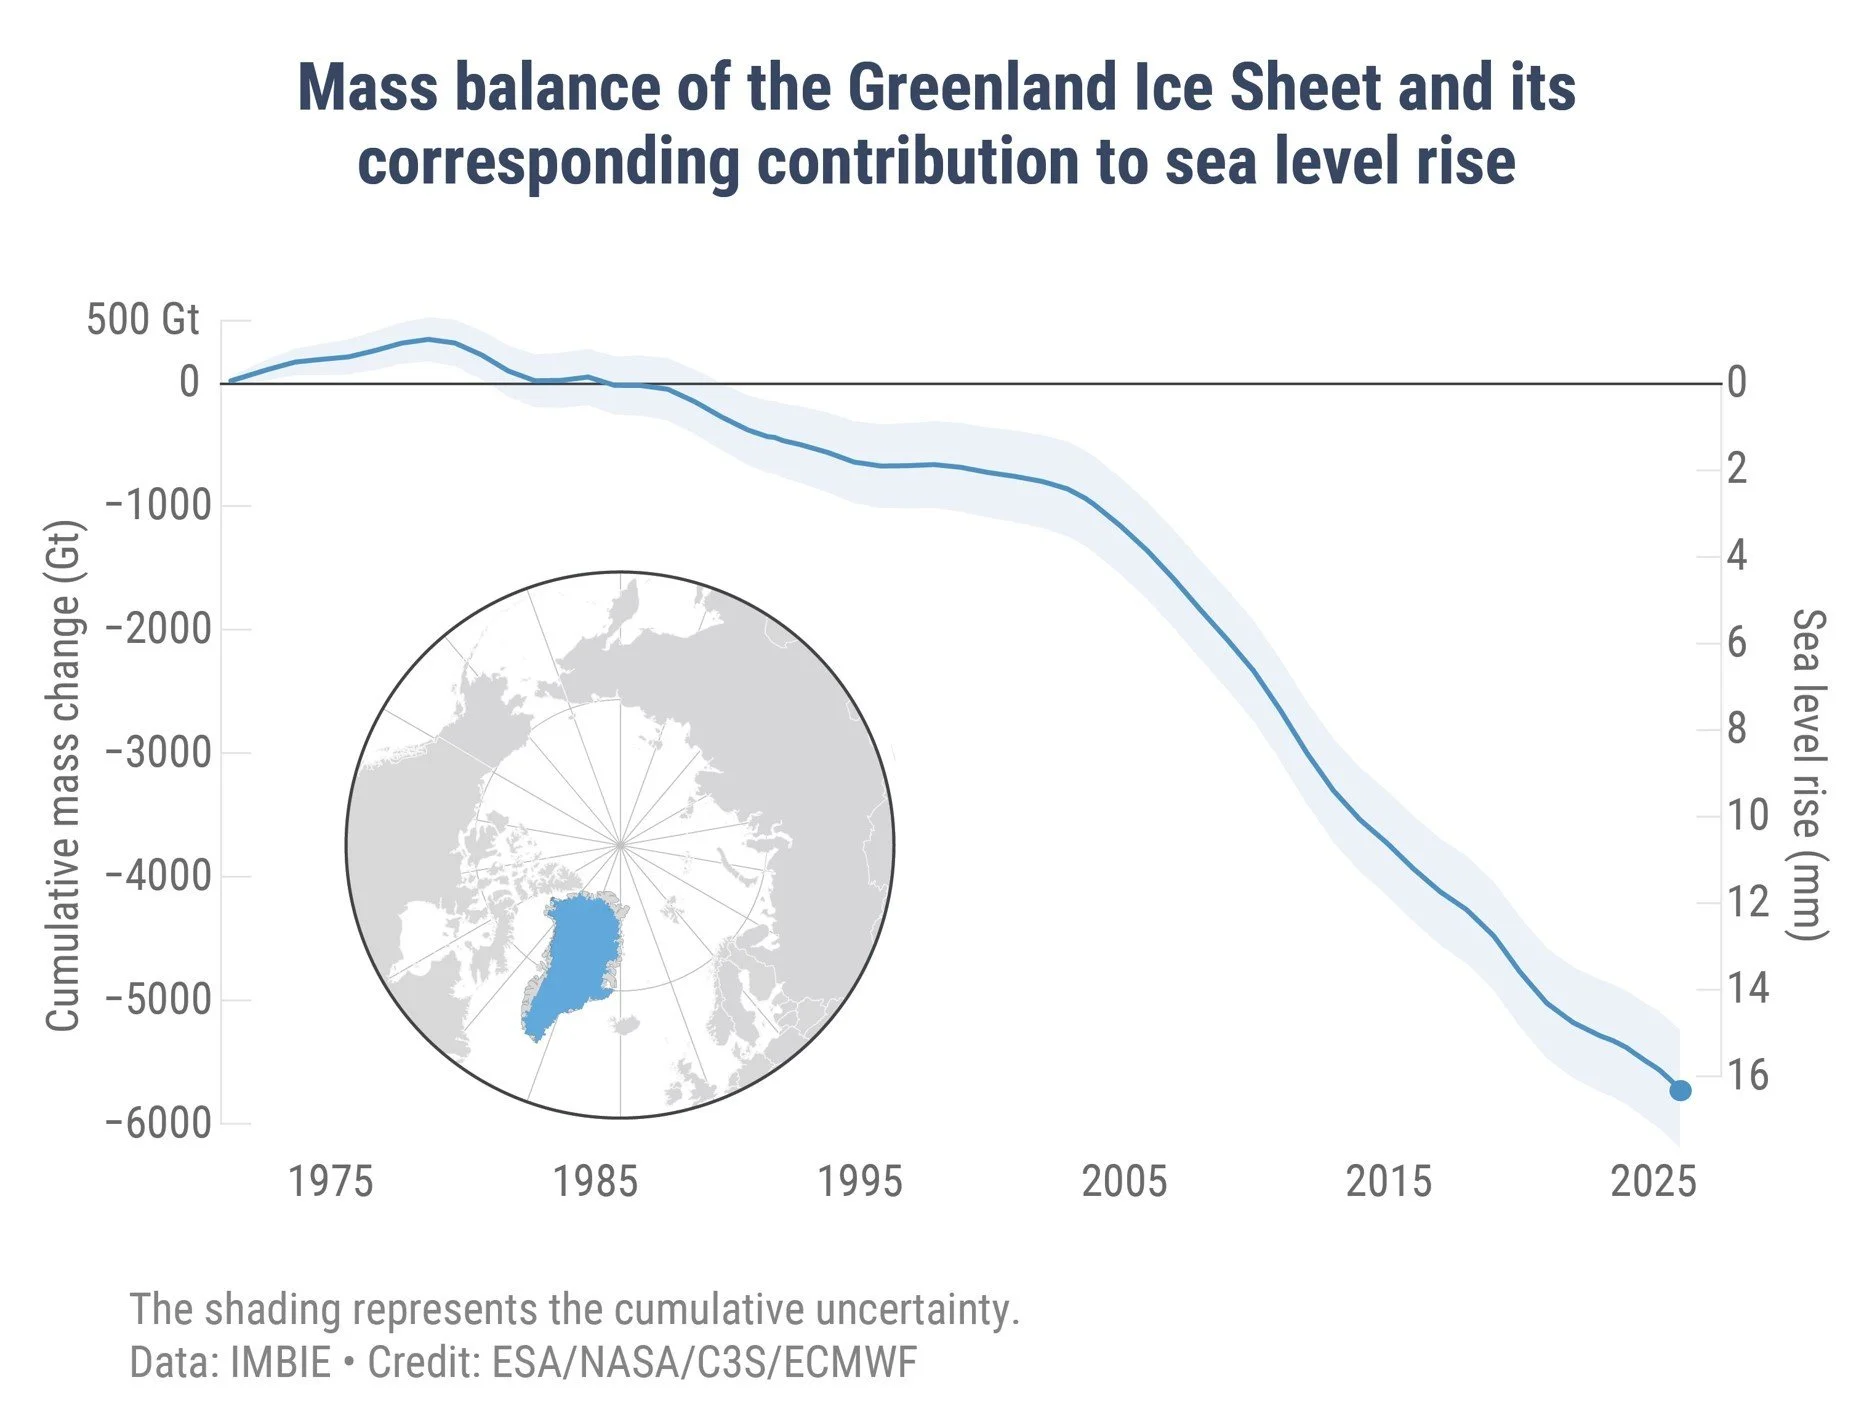
Just as with glaciers, the Greenland ice sheet started melting around 1900, long before so-called man-made global warming began. Its contribution to sea level rise is illustrated in the figure below, showing the cumulative ice mass change from 1972 to 2025. The rise in sea level over that period from melting Greenland ice averages 16/53 or 0.3 mm per year; the current rate of rise is approximately 0.4 mm per year.
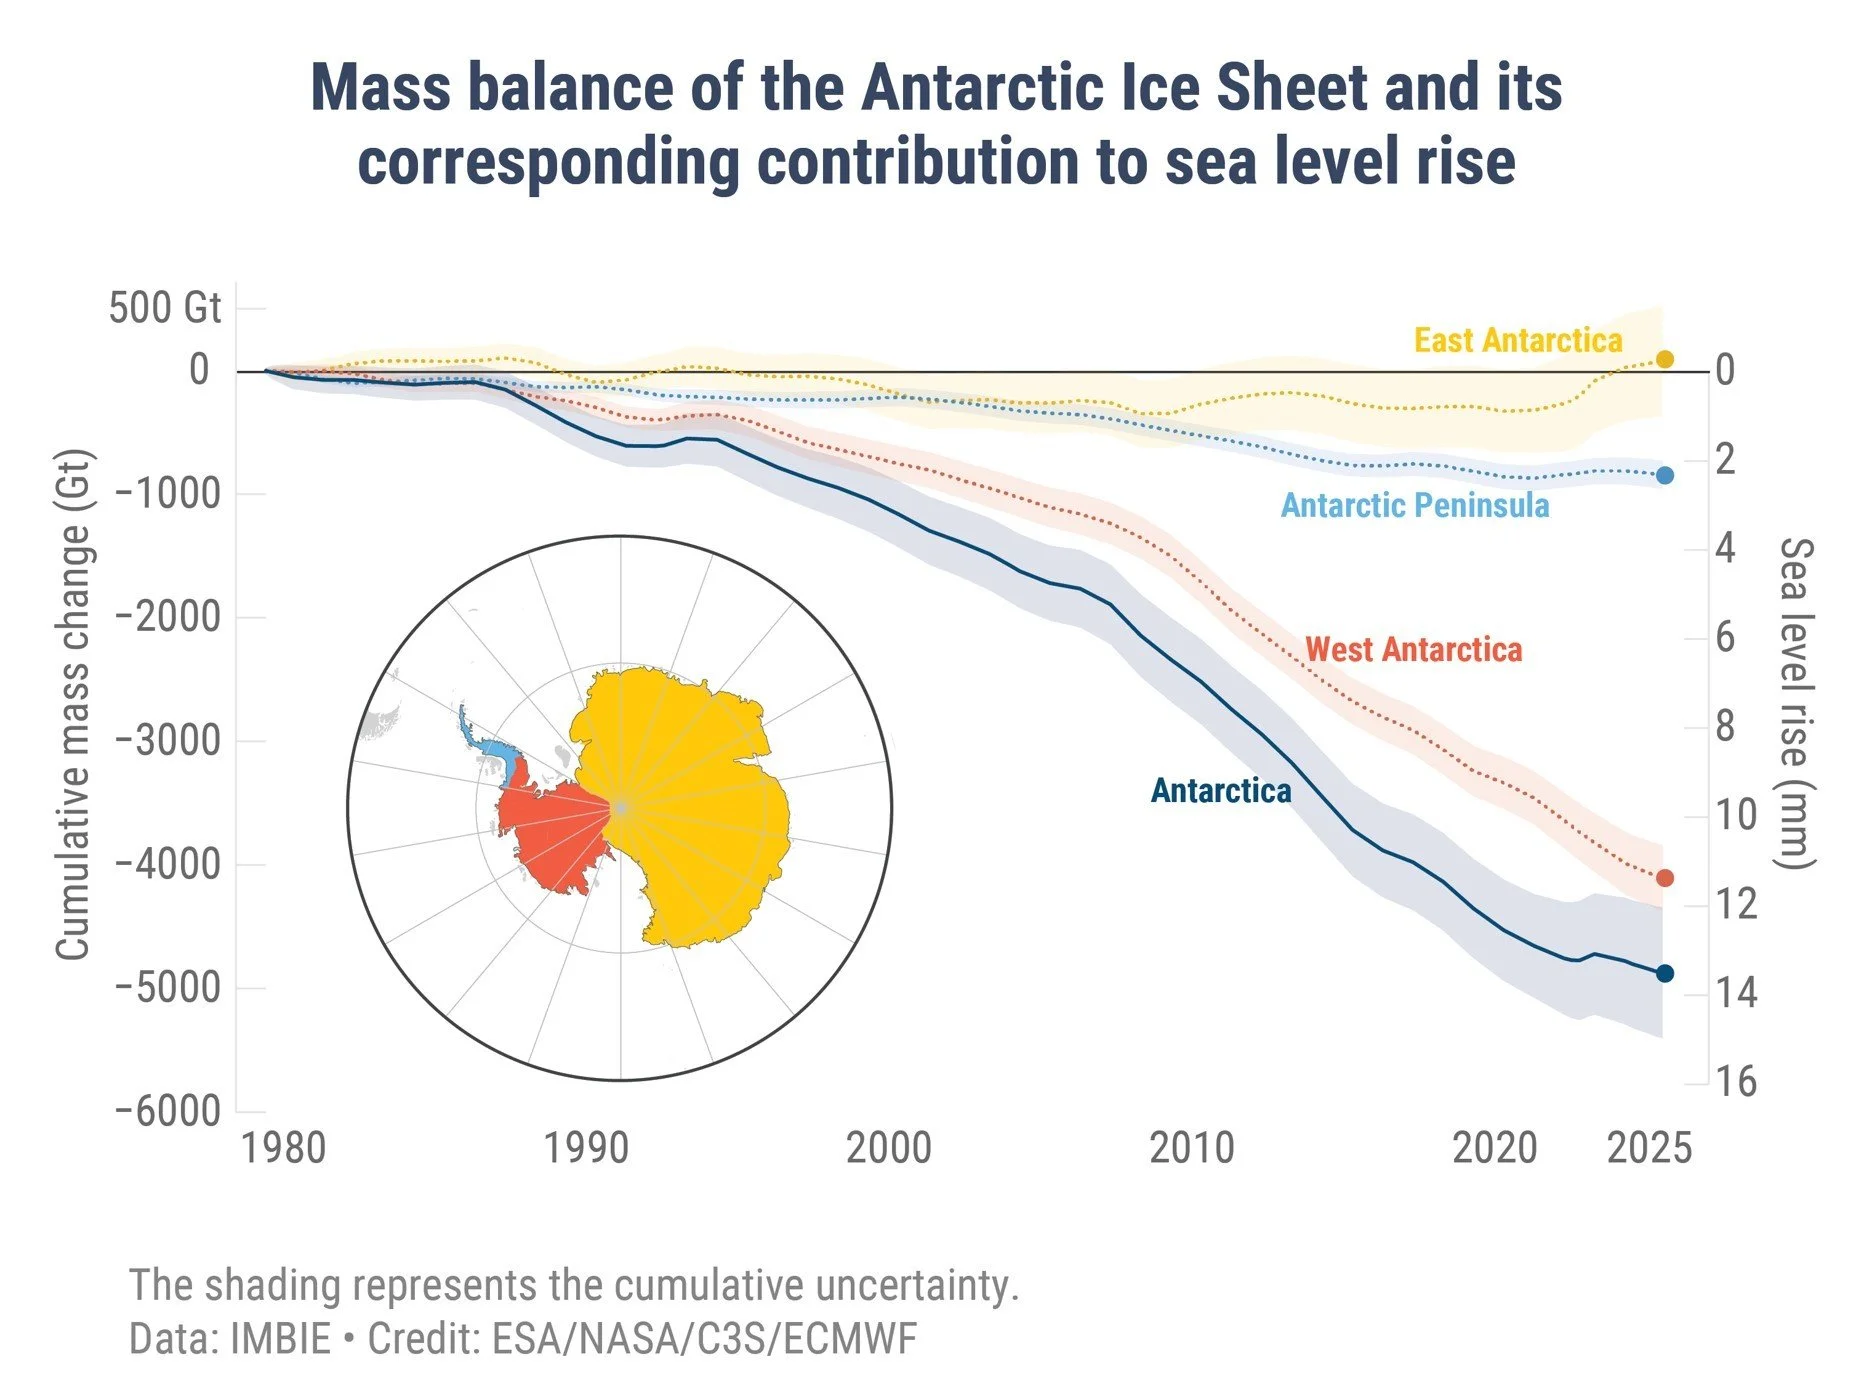
The contribution of the Antarctic ice sheet to sea level rise is illustrated in the next figure, which shows the cumulative ice mass change from 1979 to 2024. The corresponding average annual rise in sea level over that period from melting Antarctic ice is 13.5/45 or 0.3 mm, the same as from Greenland’s ice sheet; again, the current rate of rise is approximately 0.4 mm per year.
West Antarctica
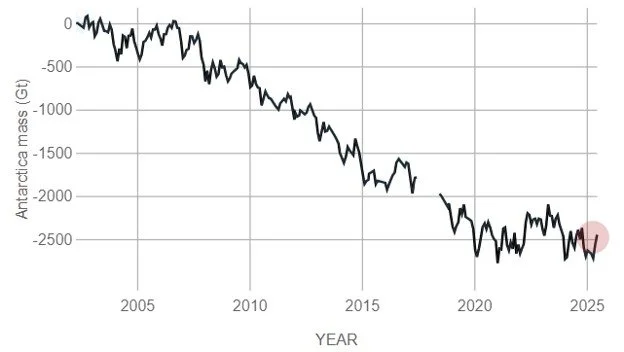
It can be seen that most Antarctic ice loss comes from West Antarctica, where melting of glaciers is significant and partly caused by active volcanoes underneath the continent. The figure below graphs changes in the total Antarctic ice sheet mass between 2002 and 2025. You can see that while the loss rate accelerated during the two decades after 2002, it appears to have stabilized since 2021.
The total contribution to sea level rise of melting ice from glaciers and ice sheets is approximately 1.8 mm per year. The remainder of the current average rise rate of 4 mm per year is due to the expansion of seawater as it warms; sinking of the seafloor under the weight of extra meltwater; and land subsidence from groundwater depletion, or rebound after melting of the last ice age’s heavy ice sheet.
This article was published first on ScienceUnderAttack on 14 September 2026.

Ralph B. Alexander
Ralph B. Alexander, a science writer who puts science above political correctness, is the author of several recent reports on weather extremes and global warming; he has also authored “Science Under Attack: The Age of Unreason” and “Global Warming False Alarm”. With a PhD in physics from the University of Oxford, he has written numerous scientific research papers and reports on complex technical issues. Dr. Alexander has been a researcher at laboratories in Europe and Australia, a professor at Wayne State University in Detroit, the co-founder of an entrepreneurial materials company, and a market analyst in environmentally friendly materials for a small consulting firm. He grew up in Perth, Western Australia and currently lives in California.
The article you have just read was made possible by our donors.
Every day, Clintel publishes articles on climate, energy and science. We also translate and share international analyses in multiple languages, produce videos, publish reports and organize conferences and events around the world.
We receive no government funding and rely entirely on the support of our donors. Your support helps us promote independent research and contribute to a more open and balanced debate on climate and energy issues.
Would you like to support our work? Choose the option that suits you best:
• Become a Friend of Clintel – support us with an annual contribution
• Make a recurring donation – provide ongoing support and help us plan ahead
• Make a one-time donation – every contribution helps
Thank you for your support.

more news
Norway keeps on drilling in the Arctic
Norway’s Minister of Energy Terje Aasland has told Reuters that his country will keep developing oil and gas in the Barents Sea irrespective of a European Union (EU) ban on Arctic drilling.

Was 2026 really the “hottest summer on record” in the United States?
Summer 2026 was the “warmest on record” in the US based on average daily temperatures. But not when measured by average daily maximum temperatures, says Chris Martz. Furthermore, there are legitimate concerns about the adjustments NOAA applies to its raw data.

Press Blames Climate Change for Bear Encounters
Some news media now blame climate change for bears breaking into cars and homes in Colorado. They are promoting the catastrophe narrative of climate change in any way they can, regardless of nuances, says Linnea Lueken.
The post How Much of a Threat Are Melting Ice Sheets and Glaciers? appeared first on Clintel.
Please consider helping!
Awake Freedom TV On Roku is Broken! 🙂

I could no longer maintain the costs on my own, so I moved the off of a dedicated server which was needed for the TV platform to work. On top of that, I want to build an app Awake Freedom TV app, for mobile phones. We need your help to first resurrect our TV channel, and then build the mobile app. In order to do that, I need a minimum of 800/month on subscription payments. Please help anyway you can with the form below.


Leave A Comment